

How Do You Calculate Homogenization Efficiency?
Two trials can both be described as “90% efficient” while measuring entirely different things. One may refer to a reduction in average particle size, another to recovered product mass, and a third to a dairy-specific test result. Comparing the percentages without their definitions can lead to the wrong pressure, too many passes or an unrealistic production estimate. A useful calculation starts by deciding what the process must achieve and what resources it consumes. This guide separates the main metrics, works through a hypothetical batch, and shows which sampling and time records are needed to make a comparison that an engineer can reproduce.
There is no universal homogenization efficiency formula for every product. For a defined particle-size statistic, size reduction is (initial size minus final size) divided by initial size, multiplied by 100%. Accepted-product recovery is accepted mass divided by feed mass, multiplied by 100%. Specific electrical energy is measured energy divided by accepted product mass or volume. These metrics answer different questions and should be reported together with pass count, pressure, temperature and measurement method. Dairy homogenization indices have their own defined tests; do not relabel a generic size-reduction percentage as a validated milk-stability result.
Choose the result before choosing the formula
The Tetra Pak Dairy Processing Handbook relates dairy homogenization efficiency to fat-globule size and creaming stability, and describes ways of assessing homogenization. That application-specific meaning is not automatically transferable to a pigment dispersion, cell-disruption process or pharmaceutical emulsion.
To calculate homogenization efficiency for a development trial, write the acceptance question first. Is the objective a specified particle-size distribution, a stable emulsion, release of a target intracellular material, or accepted output at a reasonable energy cost? Each requires an appropriate measurement. A smaller mean size is not necessarily useful if a coarse tail remains outside specification.
For a laboratory high-pressure homogenizer, record the sample and measurement method alongside pressure and passes. This makes a later comparison with another configuration meaningful instead of turning the trial into a list of machine settings.
| Metric | Calculation or basis | What it tells you |
|---|---|---|
| Defined size reduction | 100 × (d before − d after) / d before | Relative change in the same selected particle-size statistic |
| Accepted mass recovery | 100 × accepted mass / feed mass | How much feed becomes accepted, recovered product |
| Specific electrical energy | Metered electrical energy / accepted mass | Energy used per unit of accepted output within the stated boundary |
| Accepted production rate | Accepted mass / defined elapsed process time | Output after accounting for the chosen time boundary |
| Dairy homogenization index | Use the named dairy test method and its formula | The result defined by that method, not a universal efficiency percentage |
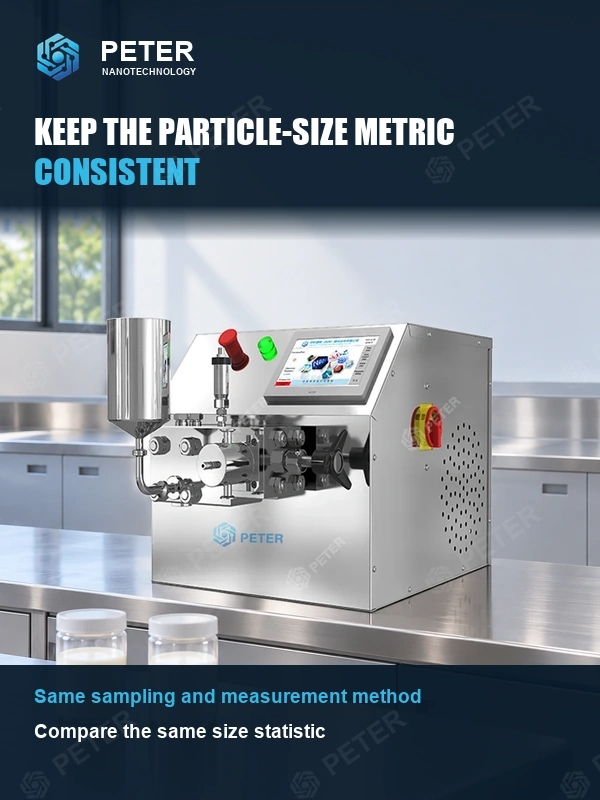
Keep the particle-size metric consistent
Compare the same statistic before and after treatment. A volume-based D50 and an intensity-weighted average from a different technique are not interchangeable. State the measurement principle, sample preparation, dilution, temperature and data basis. If the method reports a distribution, retain the distribution and an appropriate coarse-tail measure rather than reporting only a single average.
Sampling can create an apparent improvement before the machine does anything. Settling, selective withdrawal, dilution-induced breakup or inconsistent preparation can change what reaches the instrument. Use a defined collection and preparation method for both samples, and assess repeatability using independent representative samples where appropriate. Repeated readings of the same prepared aliquot alone do not capture batch sampling variation.
When a formula involves a ratio, the definition of each term must be stable. NIST’s guidance on evaluating measurement uncertainty provides a general framework for considering uncertainty; it is not a homogenizer-specific acceptance standard.
Use a worked example without mixing the percentages
Consider a hypothetical batch with a volume-based D50 of 10 µm before processing and 2 µm afterward, measured using the same method. The D50 reduction is (10 − 2) / 10 × 100 = 80%. This says nothing by itself about the largest particles, long-term stability or product recovery.
Suppose the same trial starts with 100 kg of feed and yields 92 kg of recovered product that meets all agreed acceptance criteria. Accepted mass recovery is 92%. If the defined electrical-energy boundary records 12 kWh, specific energy is 12 / 92 = 0.130 kWh/kg of accepted product, equivalent to about 130 kWh per tonne. These are illustrative numbers, not results for a CAS PETER machine.
If elapsed processing time within the chosen boundary is two hours, accepted output is 46 kg/h. The four results can coexist: 80% D50 reduction, 92% accepted recovery, 0.130 kWh/kg and 46 kg/h. Calling them all “efficiency” without their units would conceal the differences.
| Illustrative input | Value | Reported result |
|---|---|---|
| D50 before and after | 10 µm and 2 µm | 80% D50 reduction |
| Feed and accepted recovered mass | 100 kg and 92 kg | 92% accepted mass recovery |
| Measured energy and accepted mass | 12 kWh and 92 kg | 0.130 kWh/kg accepted product |
| Elapsed time and accepted mass | 2 h and 92 kg | 46 kg/h accepted output |
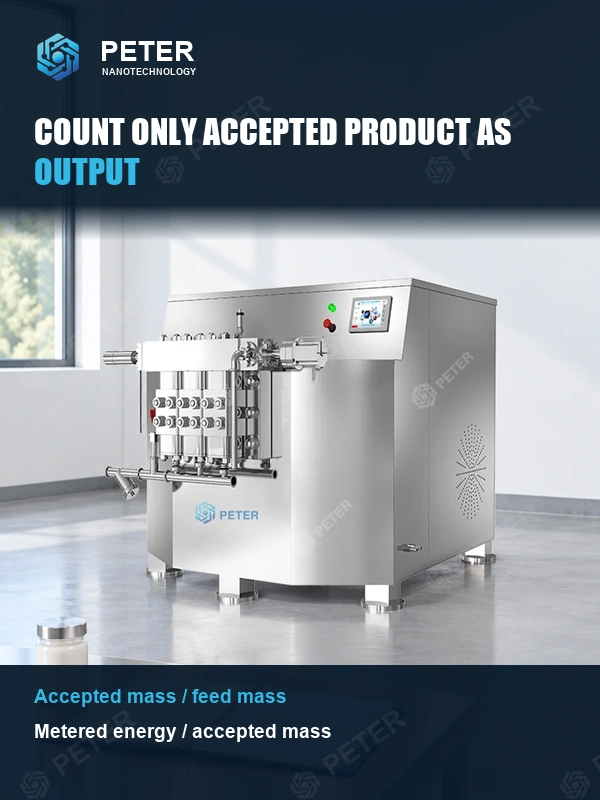
Count only accepted product as output
Define the energy boundary before comparing trials. Motor nameplate power multiplied by elapsed time is not the same as measured energy consumption. Decide whether the calculation includes feed pumping, cooling, holding and cleaning, then use the same boundary for both options. Otherwise, an apparently efficient process may simply have moved a large energy demand outside the measurement.
The same rule applies to mass. Rejected material, unrecovered hold-up and material removed as samples should be reconciled rather than quietly counted as saleable output. A trial with smaller particles but substantially lower recovery may be less attractive for an expensive formulation.
For a production homogenizer efficiency assessment, request data based on accepted output for the actual product and configuration. A supplier’s rated flow describes a machine condition; it does not automatically describe net output after every required pass and quality check.
Count passes and time according to the actual flow arrangement
In a separated batch-pass arrangement, each complete pass processes the batch through the machine once. In a recirculating tank, elapsed time multiplied by flow and divided by batch volume gives a nominal turnover count, not proof that every fluid element received the same number of passes. Mixing and residence-time distribution matter.
The distinction is developed in the site’s batch, recirculation and continuous homogenization guide. Record the actual arrangement when comparing trials; “three passes” can otherwise hide a major difference in product exposure.
Additional passes are justified when they deliver a needed quality improvement within acceptable temperature, recovery and energy limits. If the change is within measurement uncertainty or the product already meets specification, more processing may add cost without a demonstrated benefit. The US Department of Energy’s pumping-system sourcebook provides broader system-efficiency context, but the product acceptance decision remains application-specific.
Report the result so another engineer can reproduce it
A useful homogenization efficiency report includes the formulation and feed condition, machine configuration, pressure, temperature, pass arrangement, sampling method, size statistic, accepted yield and measurement boundary. State which readings are measured and which are calculated, and keep the raw data.
Report an appropriate level of precision. A calculation carried to four decimal places is not four-decimal-place knowledge if the mass, flow or particle-size measurements are much less precise. For a purchasing decision, compare repeatable accepted output and its cost rather than selecting whichever isolated percentage looks largest.
Frequently Asked Questions
How do you calculate homogenization efficiency?
First define what efficiency means for the application. Calculate size reduction, accepted recovery, specific energy or a named dairy index using the corresponding data, and report the definition and units with the result.
Which measurements are needed to calculate homogenization efficiency?
For size reduction, use comparable before-and-after size measurements. For recovery and energy efficiency, also measure feed mass, accepted output, elapsed time and actual energy within a stated boundary.
Should efficiency be based on particle-size reduction or product recovery?
They answer different questions, so report both where they affect the decision. A strong size-reduction result can still be unattractive if product recovery or accepted output is poor.
How does energy consumption affect homogenization efficiency?
It changes the resources needed per unit of acceptable product. Use measured energy divided by accepted output, and keep the same equipment and time boundaries when comparing conditions.
How should pass count and residence time be included in the calculation?
Record how the fluid actually travels through the system and which operations are included in elapsed time. A recirculation turnover estimate is not proof of an equal pass count for every fluid element.
What is the difference between process efficiency and particle-size reduction?
Particle-size reduction describes one physical change. Process efficiency also considers accepted yield, throughput, energy, time and any other resources needed to meet the complete product specification.
References
- Tetra Pak Dairy Processing Handbook: Homogenizers
- NIST Technical Note 1297: Measurement uncertainty
- US Department of Energy: Improving Pumping System Performance
Conclusion
A useful efficiency calculation makes the process easier to compare, not easier to advertise. Define the quality target, keep the particle-size statistic and sampling method consistent, and report accepted recovery, energy and elapsed time separately. Label hypothetical calculations and preserve the raw measurements so the result can be checked. When several settings meet the specification, compare their repeatable accepted output and resource use rather than assuming the smallest measured size is best. For a CAS PETER homogenization trial, agree on those measurements and boundaries before testing. The result should show which operating conditions meet the product requirement with an acceptable production burden, and where the remaining uncertainty lies.