

DLS vs Laser Diffraction After Homogenization: A Practical Guide
DLS and laser diffraction measure particle size through different physical models, so their reported sizes should not be treated as interchangeable. Dynamic light scattering estimates hydrodynamic size from diffusion, while laser diffraction infers an equivalent-sphere size distribution from angular scattering. After homogenization, choose a method that can detect the feature relevant to product quality, define the distribution basis and keep sampling and preparation consistent. A DLS Z-average is not a laser-diffraction D50, and neither single number proves that a formulation is stable or that its coarse fraction is acceptable.
This guide addresses measurement decisions after a homogenizer trial. It complements the broader nanoparticle homogenizer selection guide by showing how to write a result that a laboratory, supplier and production team can interpret in the same way.
Choose the quality question before choosing the instrument
Start with the failure you need to detect. Is it a coarse tail in a suspension, a change in the main droplet population, or aggregation during storage? Is the sample a narrow dispersion or a mixture of populations? Describe the material and the decision before asking an instrument to produce a convenient average.
A development target such as “smaller particles” is incomplete. State the metric, its measurement basis, the sample condition and any separate acceptance requirement. A useful specification might require a defined distribution statistic plus a coarse-fraction check and stability assessment. The numerical limits must come from product requirements and method capability, not from a generic article.
Compare results within an established method first. If an analytical method changes during development, evaluate the consequences explicitly. Do not interpret the difference between two instruments as a processing improvement until sampling, physical measurement principles and data treatment have been addressed.
What DLS measures and why the medium matters
DLS analyzes time-dependent scattering fluctuations associated with particle diffusion. The resulting hydrodynamic diameter describes an equivalent diffusing sphere, including the influence of the surrounding medium and particle surface. The dispersion medium’s viscosity and measurement temperature are inputs that need to represent the sample condition.
The scope of ISO 22412:2025 covers average hydrodynamic size and size-distribution measurement for mainly submicrometre particles, emulsions and fine bubbles in liquids. That scope does not mean every formulation is suitable without method development. Instrument configuration, concentration and sample behavior still determine whether a particular measurement is meaningful.
For a formulation trial, retain the reported Z-average and polydispersity information where appropriate to the method, together with quality indicators and the original distribution output. Avoid reducing an obviously complex result to one number simply because that number fits a supplier’s comparison sheet.
What laser diffraction measures and what D50 leaves out
Laser diffraction analyzes the angular scattering pattern using an optical model. ISO 13320:2020 describes this approach and the equivalent-spherical representation. Non-spherical particles can therefore produce results that differ from methods based on other physical principles. Confirm the optical assumptions and distribution basis used in the actual method.
When a report specifies a volume-based D50, it describes the size below which half the modeled particle volume lies. It says little about an extreme coarse fraction by itself. Include additional distribution information appropriate to the problem, such as a volume-based D90 and the full curve, while recognizing that even these require a capable sampling and measurement method.
A plotted peak may also move when dispersion preparation changes. If the analytical procedure uses stirring or ultrasound, determine whether that step breaks agglomerates that the production process was supposed to eliminate. Otherwise, the laboratory preparation may conceal a real process difference.
DLS vs laser diffraction: a practical comparison
| Question | DLS | Laser diffraction | Trial implication |
|---|---|---|---|
| What does size represent? | Hydrodynamic equivalent size derived from diffusion | Equivalent-sphere size distribution inferred from scattering angles | Do not assume numerical agreement between methods |
| Which output needs a definition? | Z-average, distribution output and polydispersity information | Distribution basis, percentiles and the complete curve | Write the exact metric into the acceptance plan |
| Which inputs need control? | Temperature, medium viscosity, concentration and sample handling | Optical model, concentration, dispersion conditions and sample handling | Keep the method fixed across process conditions |
| What can a single average hide? | Complex or poorly resolved populations and sample contamination effects | A problematic tail or distinct population | Review the distribution and method diagnostics |
| When is another technique useful? | When morphology or a suspected coarse fraction needs confirmation | When shape or a method-dependent distribution needs confirmation | Use microscopy or another justified complementary method |
The table is a method-selection aid based on the ISO scopes and the NCI protocol below. It is not a universal size-range chart or a claim that one technique is always more accurate.
Sampling can matter more than an extra decimal place
Take samples from a defined location after a defined mixing condition. A top-of-vessel sample may differ from one collected near settled material. A sample taken during start-up may differ from steady processing. Record the collection point, time, pass arrangement, container and any hold before measurement.
Separate instrument repeatability from sampling repeatability. Several readings from one prepared cuvette do not demonstrate that the whole batch is uniform. Where the decision warrants it, prepare independently collected representative samples and compare the variation across them. Choose the number of samples through a justified plan rather than applying an arbitrary universal rule.
The National Cancer Institute DLS protocol identifies reporting details including medium composition, viscosity, temperature, concentration, preparation and instrument conditions. Use that level of traceability when designing a method for your material; the protocol does not validate an unfamiliar formulation automatically.
Check dilution, dust removal and sonication before accepting a result
Dilution can alter the environment in which particles or droplets exist. A different diluent may change interactions or destabilize a formulation. Establish a preparation that provides a measurable sample without changing the property under investigation, and document the dilution ratio and diluent composition. A concentration series can help investigate a suspected concentration effect when used within an appropriate method.
Filtering the sample is not equivalent to filtering a clean dispersing medium. Sample filtration may remove the oversized material that matters to the customer. If filtration is used, state what was filtered and why, and assess whether it changes the represented population. Do not quietly replace an unfiltered production sample with a selectively cleaned analytical fraction.
Similarly, ultrasound used during analysis can become a second processing step. Fix its conditions when it is justified, and compare prepared and minimally altered samples when needed to understand its effect. The measurement procedure should reveal the result of homogenization rather than complete an unfinished dispersion without disclosure.
Interpret two different particle-size results without forcing agreement
Suppose an illustrative formulation gives a DLS Z-average of 180 nm and a laser-diffraction volume D50 of 0.40 µm. Converting the units yields 0.18 µm and 0.40 µm; it does not make them measurements of the same statistic. The numerical difference alone does not prove that either instrument is defective.
Review sample identity and handling first, then the method outputs and physical assumptions. Check whether both samples came from the same mixed batch, whether dilution changed the sample and whether the methods have adequate capability for the material. Consider morphology and population breadth before deciding whether a complementary measurement is needed.
Do not average the two numbers to create an “agreed particle size.” Instead, report each with its method and meaning. If a customer contract requires a particular method, demonstrate compliance using that method and manage any proposed change through an agreed comparison.
Link particle measurements to homogenizer pressure and passes
Keep feed condition, pressure, actual flow, pass arrangement and collection temperature beside the analytical result. If one trial used separate complete passes and another used tank recirculation, the exposure histories differ. The guide to batch, recirculation and continuous processing explains why nominal turnovers do not establish identical treatment.
Use a consistent measurement method to identify a useful processing plateau. If an additional pass changes the reported average only within observed variation, there may be no demonstrated improvement. Review the tail, recovery, temperature and intended stability requirement before choosing the operating condition.
The nanoemulsion development guide provides formulation context. Particle size is one part of that assessment. A freshly measured dispersion with a small average can still fail later acceptance tests, so retain the product-specific stability and quality programme.
Build an acceptance report that survives a supplier comparison
Agree the analytical method before a demonstration. Identify who collects the samples, which laboratory prepares them, how long samples may be stored and which outputs determine acceptance. Include the instrument model, method version, distribution basis, relevant optical or medium inputs and the treatment history in the report.
For the equipment discussion, the CAS PETER PT-20 homogenizer product page provides a starting point. Request performance evidence using the intended formulation and a pre-agreed measurement method. A pressure rating or an attractive sample photograph does not establish a particle-size guarantee.
Keep original files and review exceptions rather than recording only a pass/fail label. Document unusual distributions, rejected measurements and any preparation changes with their reasons. That record helps distinguish a real process improvement from a difference in sampling or analysis during later scale-up.
Watch a university introduction to DLS
Penn State MRI’s introductory video explains dynamic light scattering in a university materials-characterization context. It supplements the method discussion; it does not demonstrate CAS PETER equipment or establish acceptance limits for your formulation.
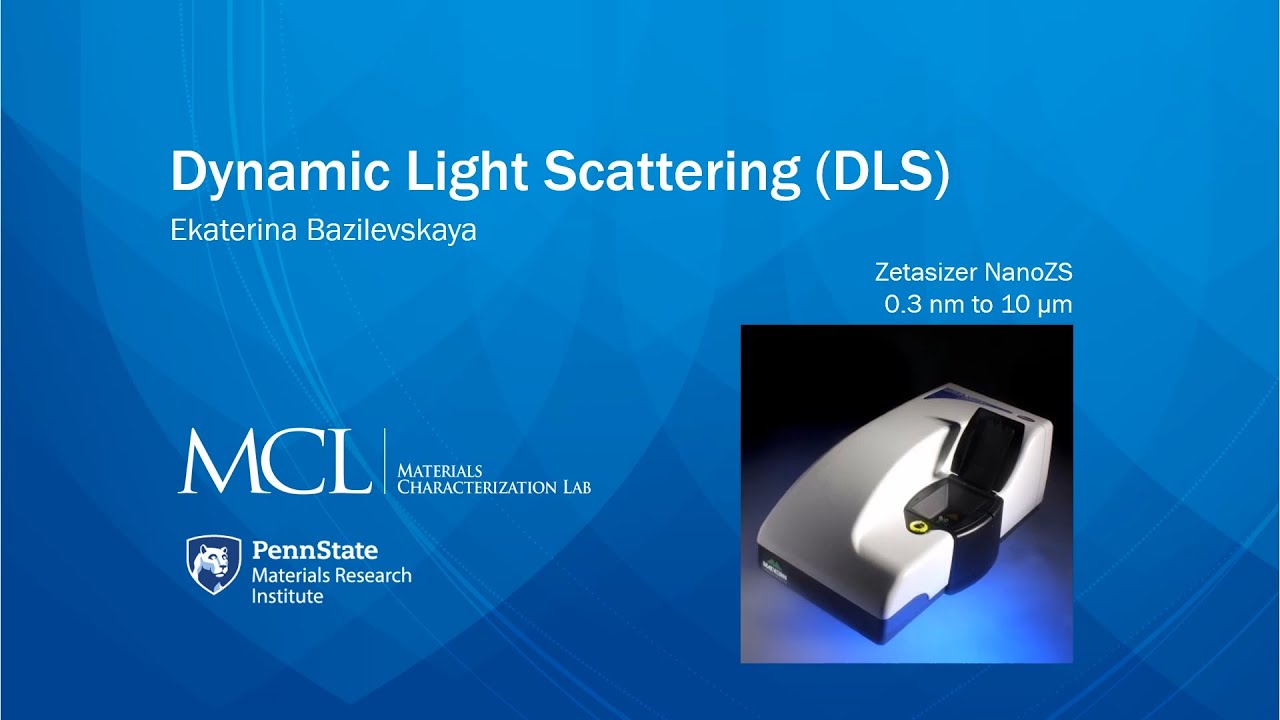
Watch Penn State MRI’s DLS introduction on YouTube.
Frequently asked questions
Is a DLS Z-average the same as laser-diffraction D50?
No. They describe different method-dependent quantities. Report the measurement principle, distribution basis and exact output rather than treating them as interchangeable averages.
Which method is better after homogenization?
Choose a method capable of detecting the relevant product attribute for the actual formulation. Population breadth, medium, concentration, coarse material and the acceptance requirement all affect that choice.
Does a lower D50 prove that the whole batch is uniform?
No. D50 alone does not describe the complete distribution or demonstrate representative batch sampling. Review the curve, relevant tail measures and independently collected samples where justified.
Should a homogenized sample be filtered before DLS?
Only when the procedure is justified for the measurement question. Filtering the sample can remove the oversized population you need to detect, so document the step and assess its effect.