

Graphene Ink Conductivity After Homogenization: Validate the Coated Film
Graphene ink conductivity after homogenization must be evaluated in a deposited film with controlled thickness, substrate and drying history. A finer or darker dispersion does not prove a better conductive coating. Processing can change flake dimensions and dispersion quality, while the finished film also depends on flake contacts, binder, residual stabilizer and deposition conditions. Compare matched coatings from each trial condition, measure sheet resistance and dry thickness, and check whether the coating remains usable in its intended application. Select the processing endpoint from film performance rather than particle size alone.
This guide focuses on conductive-film validation. The existing graphene dispersion guide covers preparation and material characterization more broadly. Here the practical question is whether changing the homogenization treatment improves the ink after it is printed or coated.
Keep dispersion quality and electrical performance separate
A stable ink is easier to handle consistently, but suspension stability and electrical conductivity are different properties. An additive that prevents sedimentation can remain between flakes in the dried coating. Additional processing may make deposition more uniform while changing the flake network. Neither outcome can be established from the appearance of the bottle alone.
Define what the ink must do before selecting the measurement. A conductive interconnect, a heater and a sensing layer have different requirements for resistance, geometry, adhesion and durability. Use the relevant application specification to define acceptance. Do not adopt a published sheet resistance as a general threshold for all graphene products.
The research paper Microfluidization of Graphite and Formulation of Graphene-Based Conductive Inks connects liquid processing to formulated inks and film measurements. It is evidence for evaluating the complete route, not proof that any homogenizer or graphite feed will reproduce its results. Equipment design, formulation and coating conditions must remain part of the comparison.
Start with a common feed and a written coating procedure
Prepare enough homogeneous feed for the planned comparison and retain a reference portion. Record graphite or graphene identity, solids loading, dispersant identity, binder content, liquid composition and any prior mixing. If the starting dispersion already contains additives, obtain the composition needed to interpret both processing behavior and dry-film properties.
Avoid comparing an untreated ink from one formulation with a processed ink that has also received a different binder or solvent. First isolate the effect of processing within one formulation. If formulation changes are necessary for printing, treat them as a second comparison and retain the original reference. This prevents an improvement caused by additive adjustment from being attributed solely to homogenization.
Write down the coating method: substrate, surface preparation, deposition tool, wet-film target, drying conditions and any later treatment. Include the time between ink preparation and coating. A freshly mixed sample and a settled sample taken from the top of a bottle may deposit different solids even when their labels show the same nominal concentration.
Use sheet resistance and thickness together
Sheet resistance describes electrical resistance in a thin sheet and is commonly reported in ohms per square. Conductivity also requires thickness. For a uniform film whose measurement supports the model:
Conductivity, σ = 1 / (Rₛ × t).
Here Rₛ is sheet resistance in ohms per square and t is dry film thickness in metres; σ is in siemens per metre. The relationship is also used in the primary study on cyclic production of few-layer graphene ink, which reports electrical measurements alongside film thickness and processing history. That study used an in-line shear-mixing process, not a validation of a CAS PETER pressure setting.
For an illustrative calculation, a film with Rₛ = 100 Ω/□ and t = 10 µm gives σ = 1,000 S/m because 10 µm equals 0.00001 m. If another film has half the sheet resistance but twice the thickness, its calculated conductivity is unchanged. These numbers demonstrate unit handling only; they are not product performance claims.
Use the equation only when the film geometry and measurement justify it. A cracked, discontinuous or strongly nonuniform coating may not be represented adequately by one bulk conductivity value. Report measured resistance and thickness data even when the assumptions for calculating conductivity are not satisfied.
Measure a representative film rather than one favorable location
Map several defined positions across each coating. Include edge and central regions when deposition produces visible thickness variation. Record the instrument, probe arrangement, sample geometry and relevant correction procedure. A two-terminal resistance measurement includes effects that differ from a suitable four-point sheet-resistance measurement, so identify the method explicitly.
Measure thickness using an appropriate method for the substrate and coating. Surface roughness, compression and the choice of reference surface can influence the result. Keep the method consistent and preserve the individual readings. Reporting only the lowest resistance and an unrelated average thickness can create a misleading conductivity estimate.
Make independently deposited films from the same ink, then repeat the promising processing condition with another preparation. This separates coating variability from preparation variability. If the variation between films is larger than the apparent treatment benefit, improve the coating procedure before concluding that the processing change helped.
Investigate flake size without assuming smaller is always better
Processing can alter lateral size, thickness distribution and aggregation. These changes affect deposition and the contacts between flakes, but no single particle-size result proves the final electrical response. A method appropriate for approximately spherical particles may not describe plate-like flakes directly. Use suitable microscopy and complementary characterization for the material question.
Inspect the coarse fraction as well as the nominal average. A small amount of large material may matter for a nozzle, coating defect or local discontinuity. If filtration or centrifugation removes that fraction, measure the retained useful material and report the separation step. Improved coating quality obtained by discarding a large part of the feed has a different process implication from improvement at constant recovery.
Use the particle-size measurement guide to frame method limitations, then select flake-specific characterization with the laboratory. Do not claim single-layer graphene, low defect density or a particular thickness distribution from a darker suspension or smaller scattering result alone. Those claims need their own evidence.
Diagnose coating changes with a controlled comparison table
The following table is a proposed diagnostic framework, not a list of measured CAS PETER outcomes. It links each observation to a comparison that helps distinguish processing changes from film-formation effects.
| Observation | Comparison to hold constant | Additional evidence | Practical interpretation |
|---|---|---|---|
| Lower sheet resistance after more passes | Dry thickness and coating geometry | Resistance map and replicate films | Check whether the change survives thickness control |
| Smoother coating but unchanged conductivity | Formulation and drying conditions | Surface image and thickness distribution | Deposition may improve without electrical improvement |
| Better printing after solids removal | Deposition and solids basis | Mass recovery and retained coarse fraction | Include material loss in the process decision |
| Lower resistance only after thermal treatment | Same thermal exposure and substrate | Film integrity and treatment compatibility | The complete coating route produces the result |
| Bottle looks stable but coating is resistive | Solids dose and additive composition | Dry-film measurements | Suspension appearance cannot qualify conductivity |
Include stabilizer, binder and drying in the trial boundary
Document every nonvolatile ingredient in the deposited film. When changing processing intensity, keep additive concentration on a defined basis. Evaporation or selective solids removal can change the ratio of graphene to binder even if no extra binder is deliberately added. Measure or reconcile the final solids content before making equal-volume coatings.
If a post-treatment is proposed, assess whether the substrate and intended product tolerate it. A treatment used on glass in a paper cannot automatically be transferred to a flexible polymer or an assembled device. Record the actual temperature-time history and the condition of the coating afterward. Avoid presenting improved conductivity without the cost or compatibility requirements of the step that produced it.
Compare usable film area, adhesion and the relevant durability test as well as electrical values. A coating with excellent initial resistance but poor attachment may fail its application. Conversely, adding binder may improve handling while changing resistance. Choose the acceptable combination from the application requirement rather than assuming that one measurement must be minimized at any cost.
Plan a pilot trial around the complete ink route
The CAS PETER PT-40 pilot homogenizer is a real equipment option for discussing a representative pilot trial. Confirm feed preparation, maximum acceptable incoming solids, abrasive-material suitability, wetted components, cleaning, cooling and collection arrangements with the supplier. Its photograph does not demonstrate graphene production performance or a qualified conductive-ink installation.
Provide the intended formulation and the coating acceptance method before asking for equipment recommendations. Graphite suspension behavior can affect feeding and wear, while solvent or additive choices affect compatibility. The dispersion methods guide gives broader context for process selection; the actual proposed material still needs equipment review.
Retain samples from each selected pass condition and produce coatings through one controlled procedure. Compare the smallest processing change that meets the application requirement with more intensive alternatives. Record material recovery, time, cooling demand and repeatability. A useful trial report should let a reviewer trace a film result back to the exact feed and processing history.
Further learning: why graphene conducts
The NPTEL-NOC IITM lecture below introduces graphene crystal structure and the origin of its electrical properties. It provides material-science background. A deposited network of flakes also depends on contacts and coating structure, so the lesson should not be read as a prediction of an ink’s measured conductivity.
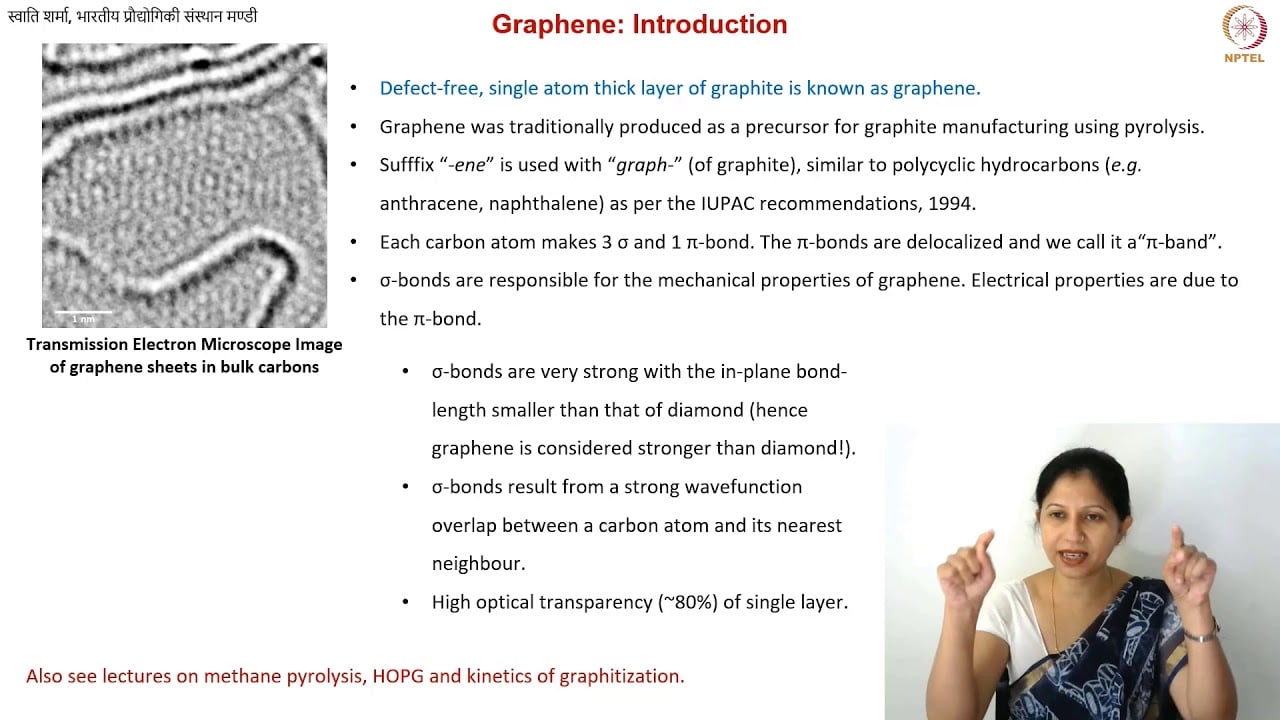
Educational source: NPTEL-NOC IITM. Watch the lesson on YouTube.
Frequently asked questions
Does a smaller dispersion particle size prove better conductivity?
No. Flake dimensions and aggregation matter, but a conductive film also depends on contacts, composition, thickness and deposition. Use appropriate material characterization alongside measurements on controlled coatings.
Can sheet resistance values be compared when film thickness differs?
They can be reported, but they do not alone establish equal-material conductivity. Measure dry thickness and use a suitable model when its assumptions are satisfied. Keep substrate, formulation, deposition and treatment history visible in the comparison.
Is a published graphene ink result a guarantee for a pilot homogenizer?
No. Published results belong to the reported equipment, feed, formulation and coating route. A pilot trial must demonstrate the required film performance using the proposed material and the actual equipment configuration.