

Graphene Dispersion by High-Pressure Homogenization: How to Verify Results
Graphene dispersion by high-pressure homogenization should be judged by the material and application attributes that the process is intended to change. Better suspension uniformity, smaller agglomerates and true exfoliation are different outcomes. A dark, apparently stable liquid does not prove a particular layer count, low defect content or improved conductivity. Define the starting carbon material, liquid medium and acceptance methods, then compare representative trials within the approved equipment window. Retain evidence of the recovered quantity as well as the properties of any selected fraction.
This guide focuses on verifying a dispersion-development result. The existing CAS PETER graphene dispersion case remains an application reference for a pre-dispersed base-oil system; it does not supply a universal pressure, pass count or particle-size result. The testing framework below supports a separate, material-specific discussion.
Identify the starting material precisely
Record whether the feed contains graphite, graphene nanoplatelets, graphene oxide, reduced graphene oxide or another supplied carbon grade. Preserve the supplier’s available characterization, lot identity and composition information. These names should not be treated as interchangeable descriptions of one material.
Also identify the liquid phase, dispersant or stabilizer, solids basis and preparation history. A result obtained in an aqueous surfactant system does not automatically transfer to a base oil or another solvent. The additives and medium can affect both processing and the usefulness of the final dispersion.
Write down the starting quality question before discussing a machine. Breaking up a supplied powder’s agglomerates is a different development objective from producing thinner flakes from graphite. If the feed already contains a specified platelet grade, further changes to that material may be undesirable even when the liquid becomes visually more uniform.
Separate dispersion from exfoliation
Dispersion work may aim to distribute material more consistently and reduce clusters. Exfoliation concerns separation of stacked layers. The two can occur together in some processes, but evidence for one is not automatically evidence for the other.
A primary study on microjet homogenization for liquid-phase graphene exfoliation investigated solids, dispersant, chamber configuration and treatment conditions together. Its formulation and apparatus define the scope of its results. The work supports a multi-variable assessment; it does not establish the same layer distribution or production yield for an untested CAS PETER configuration.
When reporting a trial, use language matched to the measurements. If the evidence shows reduced visible settling or a changed size distribution, describe that finding. Reserve a layer-count or exfoliation claim for a suitable characterization plan that actually assesses that attribute.
Choose complementary measurements before processing
| Claim under review | Evidence to plan | What is insufficient alone |
|---|---|---|
| More uniform dispersion | Representative sampling, a defined concentration assessment and consistent observations | A single photograph or one top-of-container sample |
| Reduced agglomeration | An appropriate distribution or imaging method with fixed preparation | A smaller instrument average without the method details |
| Thinner or fewer-layer material | Suitable structural characterization and a justified sampling plan | Darker liquid or a hydrodynamic-size value |
| Acceptable structural quality | Relevant spectroscopy or imaging interpreted for the material | One spectral ratio treated as a universal quality score |
| Useful application performance | A controlled test in the intended film, coating, composite or other application | Assuming dispersion appearance proves conductivity or strength |
| Useful process yield | Recovered accepted material with a stated denominator and separation boundary | Reporting only the properties of a small selected fraction |
This is a proposed evidence-planning table, not a product standard or a universal analytical specification. Select methods capable of answering the actual material question and define the acceptance limits before reviewing the results.
Do not treat one size number as a flake description
Plate-like materials introduce a shape question. A method that represents particles using an equivalent size does not necessarily report platelet thickness, lateral dimension and layer number separately. Keep the physical meaning of the selected output explicit.
If a light-scattering technique is used, document the model, sample preparation, medium and reporting basis. Compare results within a suitable method and retain the distribution and quality indicators. Do not relabel an equivalent-size result as a direct thickness measurement.
The site’s DLS and laser-diffraction comparison explains why different measurement principles produce different outputs. For graphene-related materials, add the structural or imaging evidence needed for the attribute being claimed rather than forcing several dimensions into one convenient average.
Use Raman evidence within a broader characterization plan
The original research Raman Spectrum of Graphene and Graphene Layers demonstrates the connection between Raman features and layer-related electronic structure in its studied samples. It supports Raman as an important characterization tool, not a universal rule that one peak value proves every dispersion’s layer count or quality.
Record the measurement conditions, sample preparation and how locations or flakes were selected. A convenient deposited region can differ from the whole recovered dispersion. Where the product claim requires it, use complementary microscopy or another suitable method and explain the sampling limits.
Interpret spectral changes with the material and processing history in view. Do not assume that every change has one cause or that a single ratio supplies a complete defect assessment. The report should connect the analytical interpretation to the precise claim being made.
Keep concentration and selected-fraction yield separate
A dispersion can be characterized after settling, centrifugation, filtration or another selection step. State that step and report what was removed. A high-quality selected fraction may be useful, but its properties do not describe all the carbon originally charged.
As a hypothetical mass-accounting example, suppose a trial starts with 100 g of carbon material and a downstream selection yields 12 g of accepted recovered material. Its accepted mass fraction is 12% on that starting-carbon basis, assuming the assay and accounting support those quantities. A size or structural result on that fraction does not describe the remaining 88 g.
The numbers are illustrative arithmetic, not equipment performance. Separate carbon mass from dispersant or other solids, and identify whether concentration refers to the whole slurry, a selected supernatant or another stream. If the carbon amount is inferred optically, establish an appropriate calibration and preparation basis for the actual material and medium.
Assess stability under defined conditions
Specify the container, observation interval, temperature, concentration and handling conditions. Record the appearance before disturbing the sample, then distinguish it from any result obtained after a defined mixing or redispersion step. A photograph taken immediately after vigorous shaking does not show undisturbed storage behavior.
Early primary work on graphite exfoliation in surfactant/water solutions studied production and characterization within a defined liquid system. Its scope illustrates why medium and stabilizer belong in the record. It should not be used to claim the same behavior in an unrelated oil-based formulation.
If the dispersion must survive dilution or incorporation into a final formulation, include that step in the development plan. A stored concentrate and the diluted application can behave differently. Report the actual tested condition rather than a general, unqualified statement that the material is “stable.”
Document feed suitability and the actual treatment
Provide the supplier with solids content, rheology information, the coarse feed fraction and the liquid-phase chemistry. Confirm that the proposed flow path, wetted materials and seals are appropriate. An unsuitable hard or coarse feed should not be made acceptable by simply increasing pressure.
The feed-property and capacity guide and wetted-material compatibility guide address these separate equipment questions. Use the actual formulation and configuration in the trial request, including any relevant cleaning and product-contamination limits.
Record actual flow, pressure, treatment arrangement, temperature and sampling points. Distinguish complete separate passes from recirculation. Keep the medium and dispersant consistent during the initial comparison unless formulation is intentionally a separate experimental factor.
Decide when more processing stops being useful
Compare the attributes that matter to the application as treatment increases. A finer apparent distribution can coincide with a changed lateral dimension, recovery or application result. Determine whether the next pass provides a useful improvement rather than assuming the smallest reading is always best.
Preserve temperature history. The temperature-rise guide explains why a cooled receiving sample alone does not describe the upstream exposure. Establish the permitted process and equipment window before running the material.
Use independent representative trials where the decision requires reproducibility evidence. Repeated instrument readings from one prepared aliquot cannot establish repeatable manufacturing. Retain failed and inconclusive observations so the chosen condition reflects the full experiment rather than a selected favorable image.
Verify the end-use result separately
If the dispersion will be used in a film, coating or composite, define a controlled preparation for that application test. Keep other formulation and processing factors consistent. Dispersion properties can inform selection, but they do not directly establish an electrical or mechanical result in a finished article.
Identify the accepted material available for that test, including any changes in concentration or composition caused by selection or solvent adjustment. A comparison becomes difficult to interpret if each sample is incorporated at a different actual carbon content without disclosure.
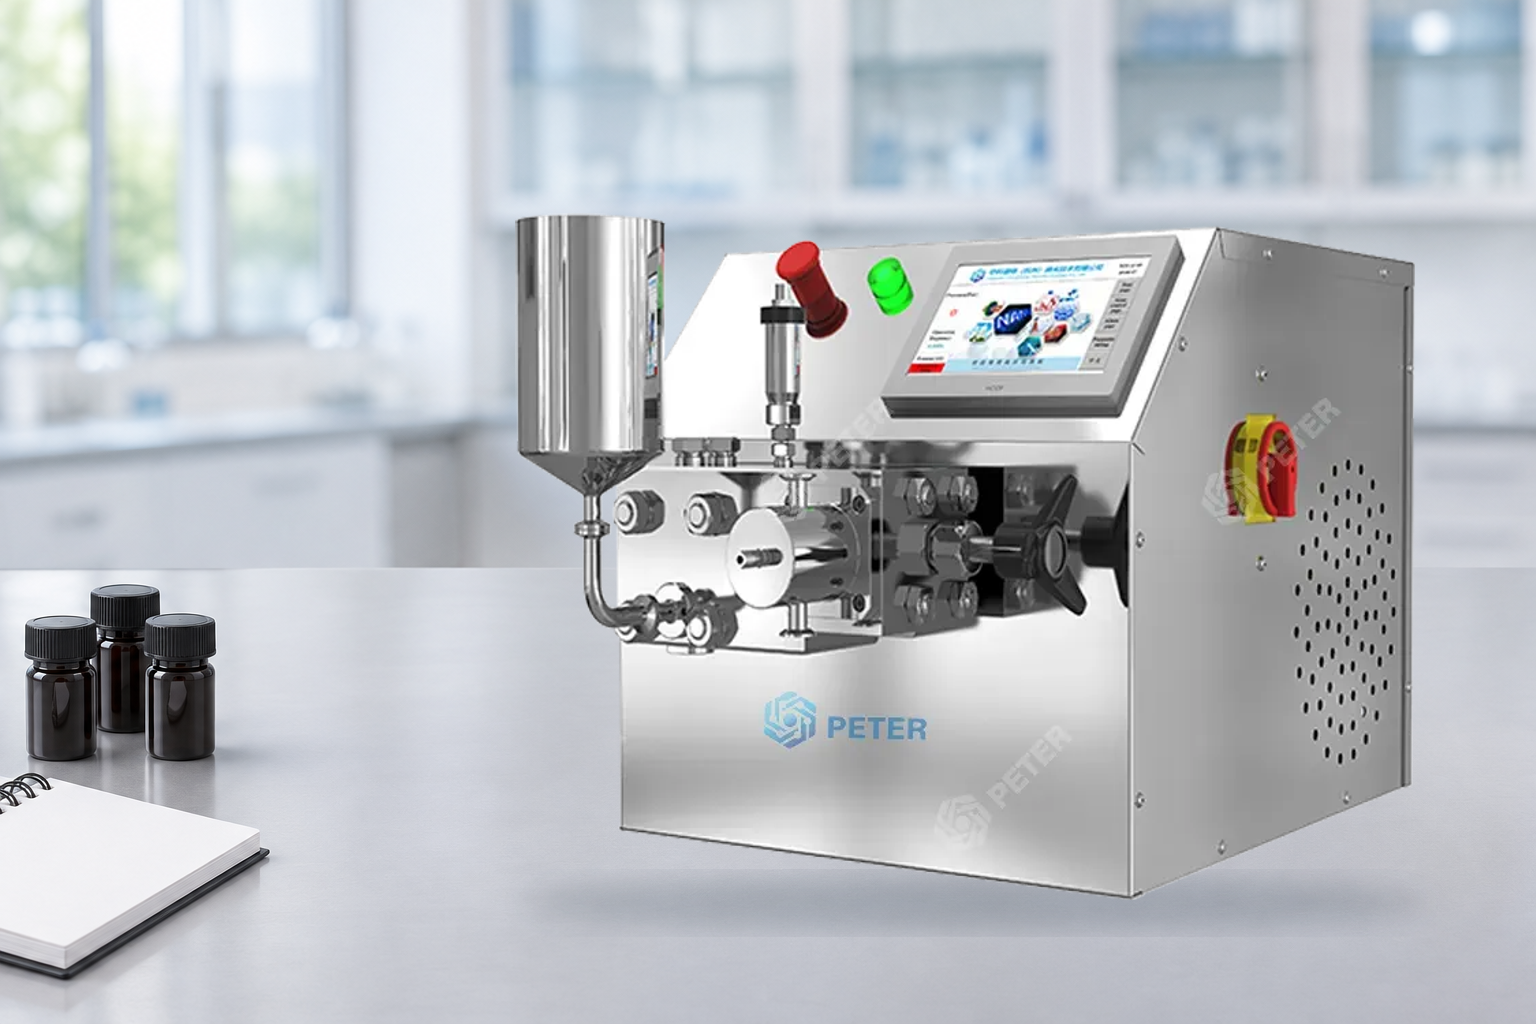
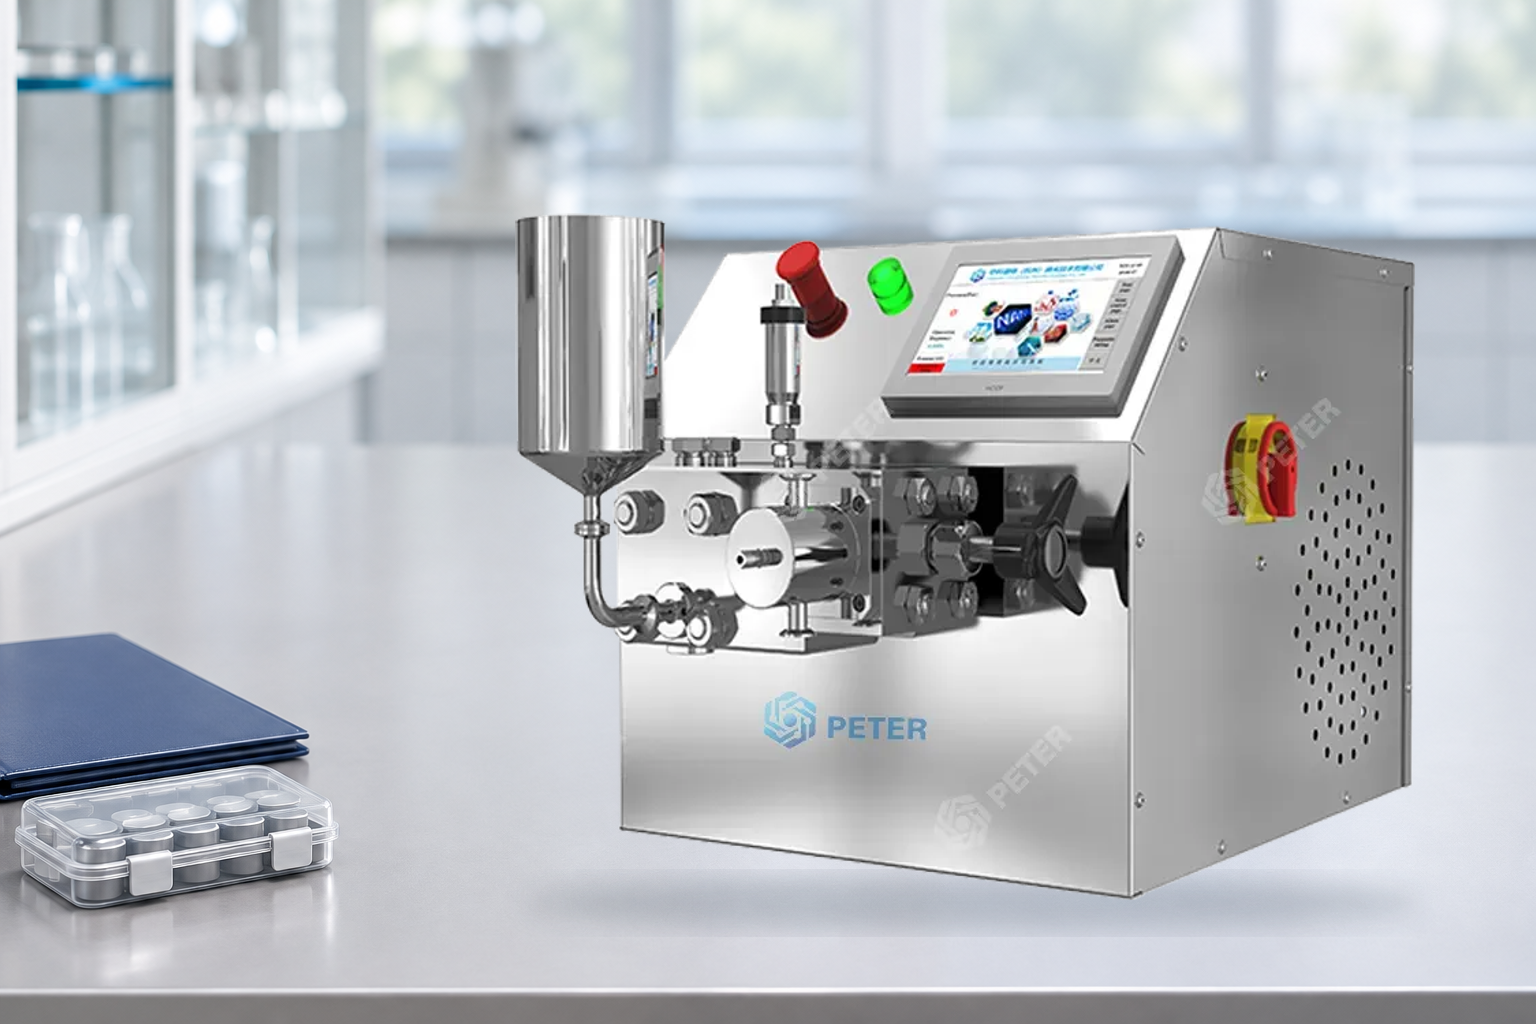
For a CAS PETER PT-20 screening discussion, provide the starting material, medium, available quantity and the measurements needed to support the intended claim. Request representative evidence rather than transferring a published research optimum from a different apparatus.
Learn the Raman background
The NPTEL lecture below explains Raman spectroscopy of carbon materials. It supplements the characterization discussion and does not provide a universal dispersion recipe, product specification or validation of CAS PETER performance.
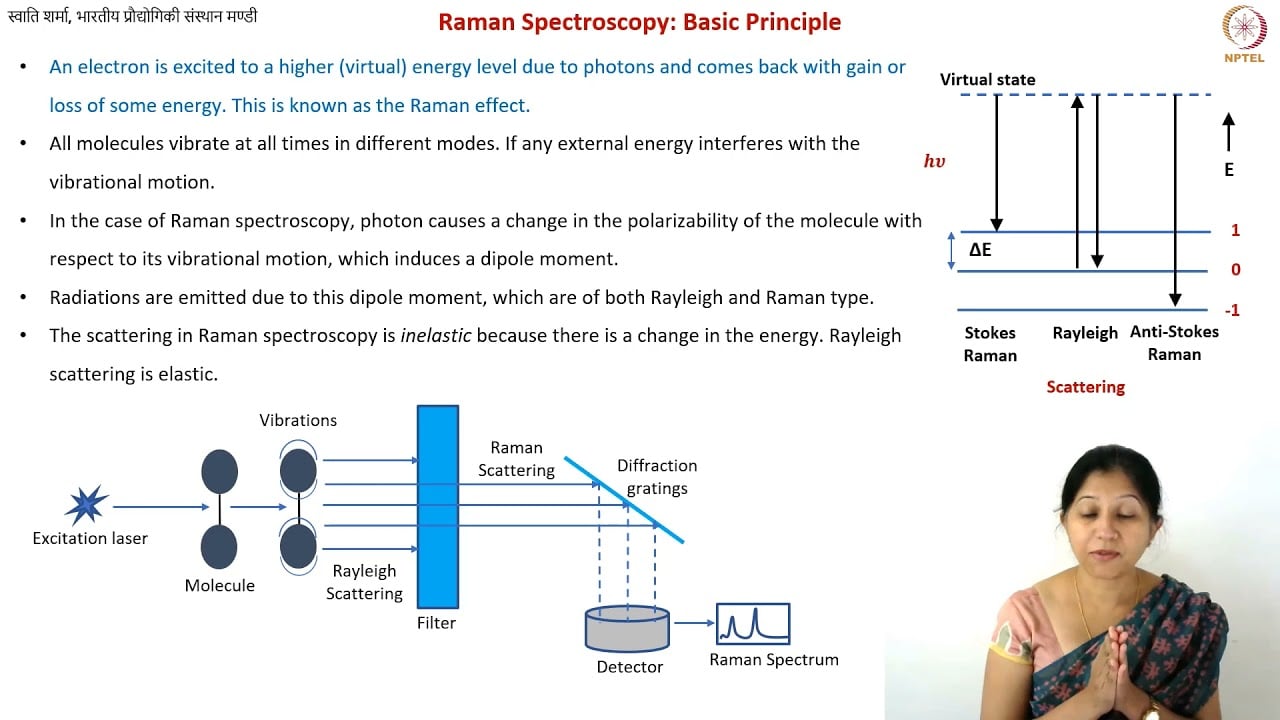
Watch the NPTEL Raman lecture.
Frequently asked questions
Does a uniform dark liquid prove graphene exfoliation?
No. Appearance can support a defined dispersion observation, but a layer-related claim requires suitable structural characterization and representative sampling.
Can DLS directly measure graphene layer count?
A hydrodynamic-size result should not be treated as direct layer counting. Use methods appropriate to structure, thickness and lateral dimensions when those attributes matter.
Should only the best supernatant fraction be reported?
Its properties can be reported, but identify the selection method and recovered quantity. Do not present the selected fraction as though it described the whole starting feed.
Does better dispersion guarantee higher conductivity?
No. Verify the intended application using a controlled test and a known material basis. Dispersion appearance alone does not establish finished-product performance.